While the infamous shipwreck happened over 100 years ago, its cultural significance is sunk deep into our collective memory as one of the most tragic manifestations of hubris, classism, and dumb luck. To that end, I analyzed the data provided on Kaggle’s website to determine more specifically how features such as age, gender, class, and wealth predetermined a passenger’s fate on April 15, 1911 aboard the RMS Titanic.
While the infamous shipwreck happened over 100 years ago, its cultural significance is sunk deep into our collective memory as one of the most tragic manifestations of hubris, classism, and dumb luck. To that end, I analyzed the data provided on Kaggle’s website to determine more specifically how features such as age, gender, class, and wealth predetermined a passenger’s fate on April 15, 1911 aboard the RMS Titanic.
“Where to, Miss?”
For this project, I wanted to predict a passenger’s fate using machine learning across several different types of models. I was also interested in identifying which features had the greatest impact on a person’s chances of survival.
This dataset is neatly packaged in a .csv file that can be downloaded from Kaggle’s Titanic competition page. In some of my other projects where the data is not so readily accessible, I have used research and web-scraping techniques to assemble my datasets.
“Remember, they love money, so pretend like you own a gold mine and you’re in the club”
Whenever I begin with a new dataset, I like to get an understanding of its shape, stats, and potential pitfalls (null values, outliers, categorical data). I use descriptors like df.info(), df.shape(), df.describe() as well as a mask I wrote to slice on columns that specifically have null values.
In sum, this dataset has 891 rows across 12 columns, five of which are categorical columns: ‘Name’, ‘Sex’, ‘Ticket’, ‘Cabin’, ‘Embarked’ and seven of which are numerical columns: ‘PassengerId’, ‘Survived’, ‘Pclass’, ‘Age’, ‘SibSp’, ‘Parch’, ‘Fare’.
Given that the ‘Cabin’ category was missing almost 80% of its data, I decided not to try to impute the missing values and instead relabeled them as “UI” (Unidentified) from which I then stripped just the first letter from all the cabins in order to make a dummy column called Cabin_category. This column organized the cabins in this neat array: ‘A’, ‘B’, ‘C’, ‘D’, ‘E’, ‘F’, ‘G’, ‘T’, ‘U’. The ‘Age’ feature, however, was only missing about 20% of its data, so it made sense to me to impute the missing values using MICE within the fancyimpute package. I decided to drop the two rows in the ‘Embarked’ feature entirely.
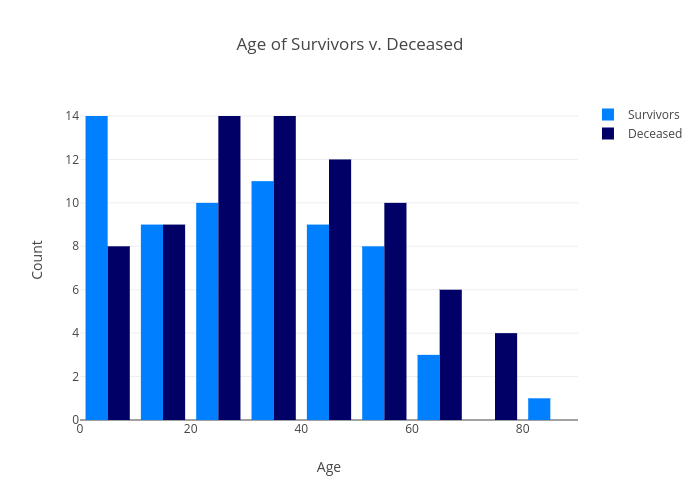
For illustrative purposes, I plotted some graphs with Plotly to help visualize the dataset. In the ‘Age’ plot, we can see that the majority of people who died were in the 20-39 bins, whereas the majority of people who lived were in the 0-9 bin. It makes sense that children would have been prioritized both in terms of what was considered the moral thing to do as well as how much space they took up on the life rafts.
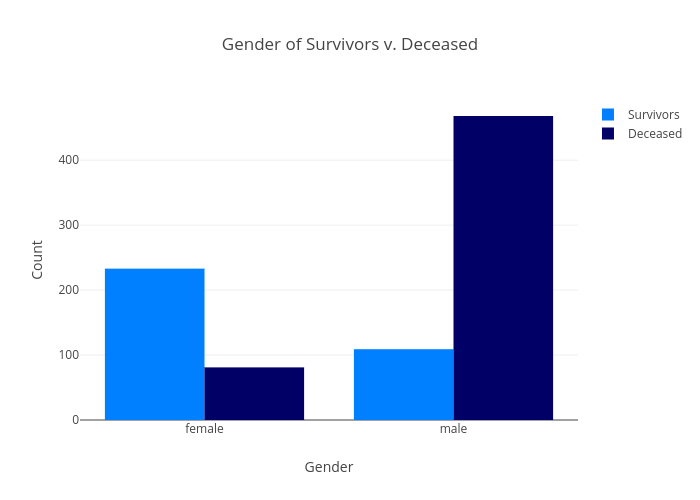
We can also see in the plot below that analyzes the gender breakdown of the people who died that the majority of those who perished were men - over four times as many as those who survived. On the other hand, the women who survived outnumbered those who perished by nearly 3:1.
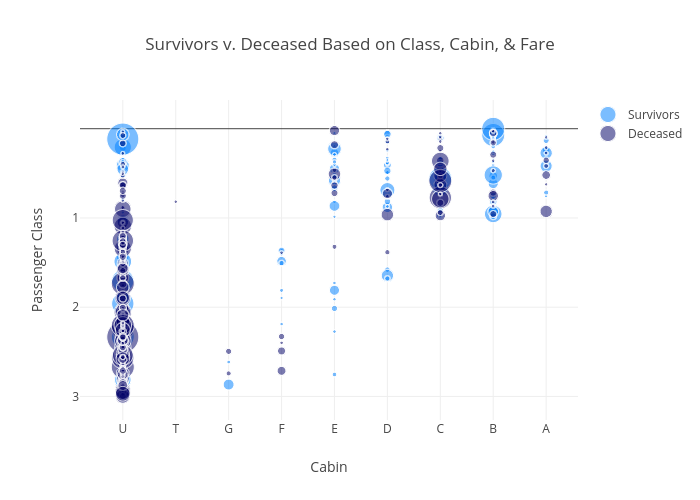
I was also interested in analyzing whether a person’s wealth played a role in their chances of survival, so I plotted a graph that analyzed the price of a passenger’s ticket as well as their class and cabin. The size of the bubble corresponds to the price of the ticket (the bigger the bubble, the more expensive the ticket.) From this plot, it looks like the passengers who were located in Passenger Class 1, Cabin B and held an expensive ticket were more likely to survive.
“You don’t know what hand you’re gonna get dealt next”
Here’s where I engineered my features, whether it was dropping columns entirely or creating new columns. For this dataset, I decided to drop the PassengerId, Name, and Ticket columns since their values do not contribute to predicting whether someone survived or not. Whether someone was male or female, however, did so I encoded those columns: 0 for male and 1 for female. I also dummified the Embarked and Cabin_category columns to determine whether those features played a role in survivability. Finally, I added columns like ‘IsReverend’ which encoded whether someone was a Reverend or not and ‘FamilyCount’ which combined the values of ‘SibSp’ and ‘Parch’ to give further detail to the model.
“It is a mathematical certainty.”
Because this is a binary prediction, I used Classifier models to predict whether a passenger survived or not, specifically, Logistic Regression, an SGD Classifier, a kNN Classifier, a Bernoulli Naive Bayes Classifier, a Random Forest, and XGBoost.
To more easily compare my R^2 scores, I generated a table to catalogue my training and test scores across all of my models. As expected, my training scores were higher than my test scores given that I fit my models to my training data. It looks like the models all fared pretty well, however, it looks like the kNN and Random Forest models were overfit, given the discrepancy between their training and test scores. Logistic Regression, SGD Classifier, and XGBoost all looked like they performed well in both the training as well as the test sets.
| Model | Penalty | Alpha | Train Score | Test Score |
|---|---|---|---|---|
| LogReg | Lasso | 0.077 | 0.844 | 0.816 |
| SGD | N/A | N/A | 0.830 | 0.816 |
| kNN | N/A | N/A | 1.000 | 0.794 |
| BNB | N/A | N/A | 0.757 | 0.757 |
| RF | N/A | N/A | 0.992 | 0.785 |
| XGBoost | N/A | N/A | 0.830 | 0.821 |
“A woman’s heart is a deep ocean of secrets.”
Based on the analysis performed in this post, it appears that men between the ages of 20 and 39 were the most likely to die while on board the RMS Titanic. Women, children, and those with higher priced tickets fared better. To illustrate this point even further, I applied the LIME package to the XGBoost model predictions to get a statistical likelihood of a passenger’s survivability based on the ‘Age’, ‘Sex’, and ‘Pclass’ features.
For example, a 28 year old male passenger in third class had an 81% likelihood of dying.

In contrast, a three year old female in first class had a 75% chance of survival.

To see all of the code associated with this project, check out the corresponding GitHub repo.


