
Reddit 'Hot' Posts
June 2018 »
Reddit claims to be the front page of the internet, and that’s because they are. With an average of 542 million monthly visitors, of which 234 million are unique, Reddit is the third most visited site in the U.S. and ranked sixth in the world. Reddit is subdivided into subreddits, which are themed discussion boards created and populated by Reddit users with links, text, videos and images. These subreddits span an endless array of interests including world news, sports, economics, movies, music, fitness, and more. Reddit members discuss proposed topics in the comments section, and the most popular comments are “up-voted” to the top of the discussion board. In 2015, Reddit users submitted nearly 75 million posts and followed up with nearly three quarters of a billion comments. With so many users, submissions, comments, and up-votes, it can seem impossible to craft a post that will ever see the light of day.
For this project, I was tasked with analyzing a subset of Reddit’s “Hot Posts” section to identify what, if any, features of a post determine its popularity. Using data science techniques like exploratory data analysis, predictive modeling, and natural language processing allowed me to efficiently search through a sample of 5,000 posts faster than I ever could have if I had just read through the posts manually.
With an endless supply of things to read on the internet, it seems impossible to write a post that anyone else but your mom will read. But with a few (hundred) keystrokes, even a platform as wild as Reddit can be neatly distilled into a handful of targeted insights.
Let’s give ‘em something to talk about
This was my first project wherein I had to gather my own data (as opposed to downloading a dataset from Kaggle, for example.) In order to build out my dataset, I scraped 5,000 posts from the “Hot Posts” section of Reddit’s website using the ‘requests’ and ‘Beautiful Soup’ libraries. Later on in the project, I used Reddit’s popular API wrapper PRAW to grab some comments from my top 50 ‘hot’ posts. After a few hours (with three second delays in between each set of 25 posts pulled so as not to be black listed by Reddit’s servers), my scrape was complete.
With any Reddit post, there are upwards of 85 identifying features, and while I did pull all 85 of those features for each of my 5,000 posts, I decided to limit the features that I built into my dataframe to those I thought would be most predictive of popularity. I pared the 85 features down to 14 and stored them in variables. The features I chose to use in my model were: ‘author’, ‘title’, ‘subreddit’, ‘subreddit_subscribers’, ‘score’, ‘ups’, ‘downs’, ‘num_comments’, ‘num_crossposts’, ‘selftext’, ‘pinned’, ‘stickied’, ‘wls’, ‘created_utc.’ If a post had actual original text, it was stored in the ‘selftext’ feature, however, when I began to explore my dataset in more depth, I learned that many Reddit posts don’t actually have original content, but rather, are links to a previous post.
With my dataframe finally built out, I was able to start exploring the posts I pulled. My un-engineed dataset began with 5000 rows and 17 columns. When I grouped by ‘subreddit’, I identified 1950 unique subreddits within my dataset. While it would be too much to name every single subreddit in this blog post, a few of my favorites were: ‘todayilearned’, ‘mildlyinteresting’, and ‘Showerthoughts.’
In exploring the null values of my ‘Text’ column which corresponded to the ‘selftext’ feature of my scrape from Reddit, only 416 of posts that I pulled had actual text in the post. The rest were empty and presumably re-posts. Given this, I decided to fill the missing values with 0 in order to keep track of which rows had actual text.
With the exception of ‘wls’ which had 684 missing entries, the rest of my dataset was filled with values. I decided to fill the missing ‘wls’ values with 6 since that was the mode for the column.
The score stats directly mirrored the ‘ups’ stats with a maximum score of 133,613, a mean score of 1,590 and a minimum score of 25. There was nothing to be gleaned from the ‘downs’ stats given that all of the data were 0s.
I also created two boolean columns ‘IsPinned’ and ‘IsStickied’ which I mapped to the ‘pinned’ and ‘stickied’ variables. I then dropped the original ‘pinned’ and ‘stickied’ object columns for modeling purposes.
The comments column, however, was the column I was most interested in, since it made sense that a post’s popularity might be greatly correlated with its volume of comments. For the posts that I pulled, the max number of comments was 20,246, the minimum, 0, the mean, 76, and the median, 16. While I did pull these posts from the ‘Hot Posts’ section from Reddit to begin with, I was tasked with identifying and mapping posts whose comments were above a certain threshold. I used a lambda function to create a new column called ‘Hot’ which represented posts 16 comments (50% percentile) and above and another column called ‘Super Hot’ which represented posts with 44 comments (75% percentile) and above.
Popular, you’re going to be pop-u-lar
I then created a bag of words of all of the words from the ‘Title’ feature using a for-loop running across the rows in the ‘Title feature’. In total, there were 10,445 unique words not including common ‘stop’ words such as ‘the’, ‘a’, & ‘and.’ I was able to exclude these common ‘stop’ words using the ‘stop_words’ arg in my CountVectorizer, specifying ‘english’ as my language.
After performing a train-test-split, I then vectorized the top 20 most common ‘Title’ words into a sparse dataframe, which I then concatenated onto my X_train and X_test matrices with the hope that more information would improve my model performance. After standardizing my dataset with Standard Scaler, I was ready to run my models.
In total, I gridsearched over six different models, including a LogisticRegression, an SGDClassifier, a KNeighborsClassifier, a BernoulliNB, a DecisionTreeClassifier, and a RandomForestClassifier. While I remain skeptical of the perfect test scores for the Decision Tree and Random Forest Classifiers, the R2 scores of the other four models seem to make sense. I summarized the results of the models into a summary bar plot, with the bold lines at the top of each bar representing the mean standard deviation of the cross validation runs. The red horizontal line represents the baseline accuracy score of 0.42779.
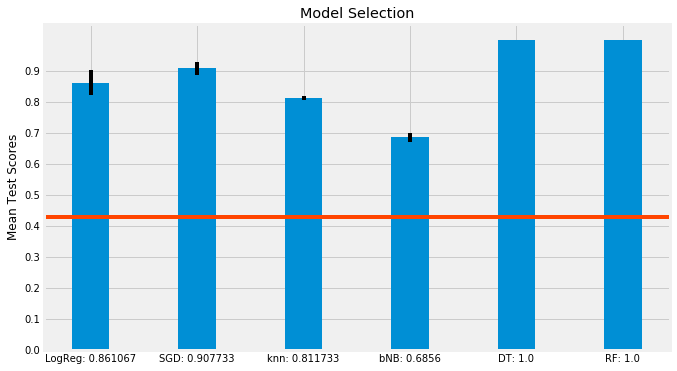
Having fit and scored my models, I chose the Random Forest Classifier to run feature importances on to understand which of my 32 features were most predictive of ‘hot’ posts. Unsurprisingly, ‘num_comments’ was the most predictive feature with a coefficient of 0.761. The next most predictive columns did not have nearly the same predictive power as num_comments, with ‘score’, ‘ups’, and ‘subreddit_subscribers’ as the next most predictive with coefficients of 0.0863, 0.0725, and 0.0247, respectively.
Gossip Folks
With modeling done, I wanted to continue exploring the text in my posts to see what, if any, themes rose to the top. Because I had already done a CountVectorizer on the titles of my posts, I wanted to try another natural language processing technique to help me better understand my data. So, I subset my data to ‘hot’ posts only (posts with 16 or more comments) and ran a for-loop across those rows to create another bag of words - this time, filled with words that were linked to ‘hot’ posts. I did the same thing again to my ‘super hot’ posts. With these two bags of words, I then used a word cloud on the data set to visually inspect any themes. The images below represent the results of this analysis. Given that one of the most common words in the ‘super hot’ bag of words was ‘need’, I suspect that more than a few people on Reddit are giving some (unsolicited) advice.
| ‘Hot’ Posts | ‘Super Hot’ Posts |
|---|---|
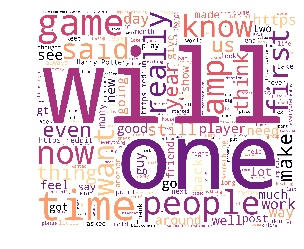 |  |
Having analyzed the text of the posts, I then wanted to further explore Reddit’s data by pulling the comments associated with my top 50 most commented on posts. First, I created a mask for which I sorted the value counts of the ‘num_comments’ feature with ‘ascending’ set to False. I then sliced on the first fifty rows.
With my top fifty most commented on posts in hand, I was ready to pull their associated comments. Because this was my first time using PRAW, I had to sign up for a developer’s account. With this account, I was given a user-id, an API key and a secret key which allowed me to use PRAW.
I wanted to pull the associated top comments so I could run a sentiment analysis on the comment’s text and see which posts received positive comments and which received negative comments. To parse out sentiment, I installed nltk’s Vader Sentiment Analyzer package.
To calculate the ‘sentiment intensity’ of each comment, I ran a for-loop across each of my fifty rows and stored the scores in a list. Vader produces four scores when performing its analysis: negative, neutral, positive, and compound. The negative, positive, and neutral scores are all bound between 0 and 1, whereas the compound score is bound between -1 and 1, to effectively give an overall score. To illustrate the range of scores my comments received, I plotted them out in Plotly. The x axis represents the negative score, the y axis, the positive score, and the color shading represents the overall compound score - compound scores that were more positive were closer to the blue spectrum and compound scores that were overall more negative were hued closer to the red spectrum. This explains why one of the data points is blue despite having greater than a 0 score on the negative x axis.
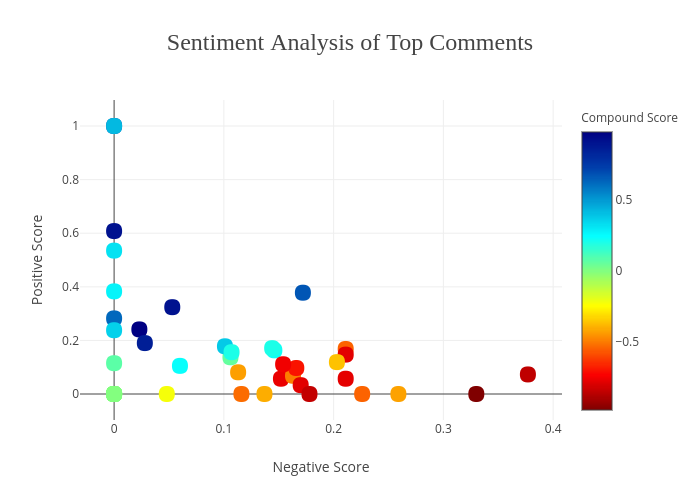
While I initially thought that having only positive comments was ideal for posts, after reading through some of the comments and their corresponding scores, I realized that everything but super negative scores is usually fine. I then joined my compound_scores dataframe with my comments_scores dataframe to more easily visualize which scores lined up with which comments and sliced on individual subreddits to identify which categories would be the least inflammatory and best received for someone interested in pitching an article to Reddit.
Finally, I wanted to try to create my own machine learning sentences using a Markov chain generator. In another post, I walk through more in depth what Markov chain’s are and how they work, but for this project, I installed the markovify package from PyPi and applied it to my ‘hot’ bag of words. Using a very simple for-loop and limiting my range to one sentence, I used the ‘beginning’ arg of the ‘make_sentence_with_start function to create one-liner sentences starting with words I specified. The following is the output of that code.
Women need to give me pity cash.
I will be replaced, and unfortunately, i don’t think Ameer will be stickying this for four days.
I can’t remember if it was pursuing me. I glanced up at her, and five days after my hospitalization it started to happen. I started working here almost two months ago. We had talked on the couch, took off my sunglasses, and checked my phone. Still no service.
Why would someone do this? There was just going to be literally upside down.
Again, these sentences were created from the corpus of ‘hot’ words I created from text in the posts I pulled from Reddit.
If you’d like to see all of the code associated with this project, head on over to the corresponding GitHub Repo.